
Clear Traffic Lights: Uncovering Spending Trends with a Red Light and Green Light Report
May 25, 2023Clear Traffic Lights: Uncover Spending Trends with a Red Light and Green Light Report
Understanding where you are in your overspending or underspending can be very overwhelming. So instead of getting stuck in a tangled web of numbers, I want to show you how to consider a red light and a green light report.
Today, I want to introduce you to one of my favorite tools! I recommend using this tool three times a year- typically at the end of the first, second and third quarter. Obviously by the fourth quarter, it's all in your rear view mirror, but those first three quarters of your fiscal year, you could really benefit from seeing this analytical look at spending.
How to Generate a Red Light Green Light Nonprofit Budget Report
Depending on the software program you use, you might have to move some numbers over to Excel and really work with them there. Ideally, you have an accounting program that is sophisticated enough to pull this report, but most of the nonprofits I work with need to use the Excel option as a workaround.
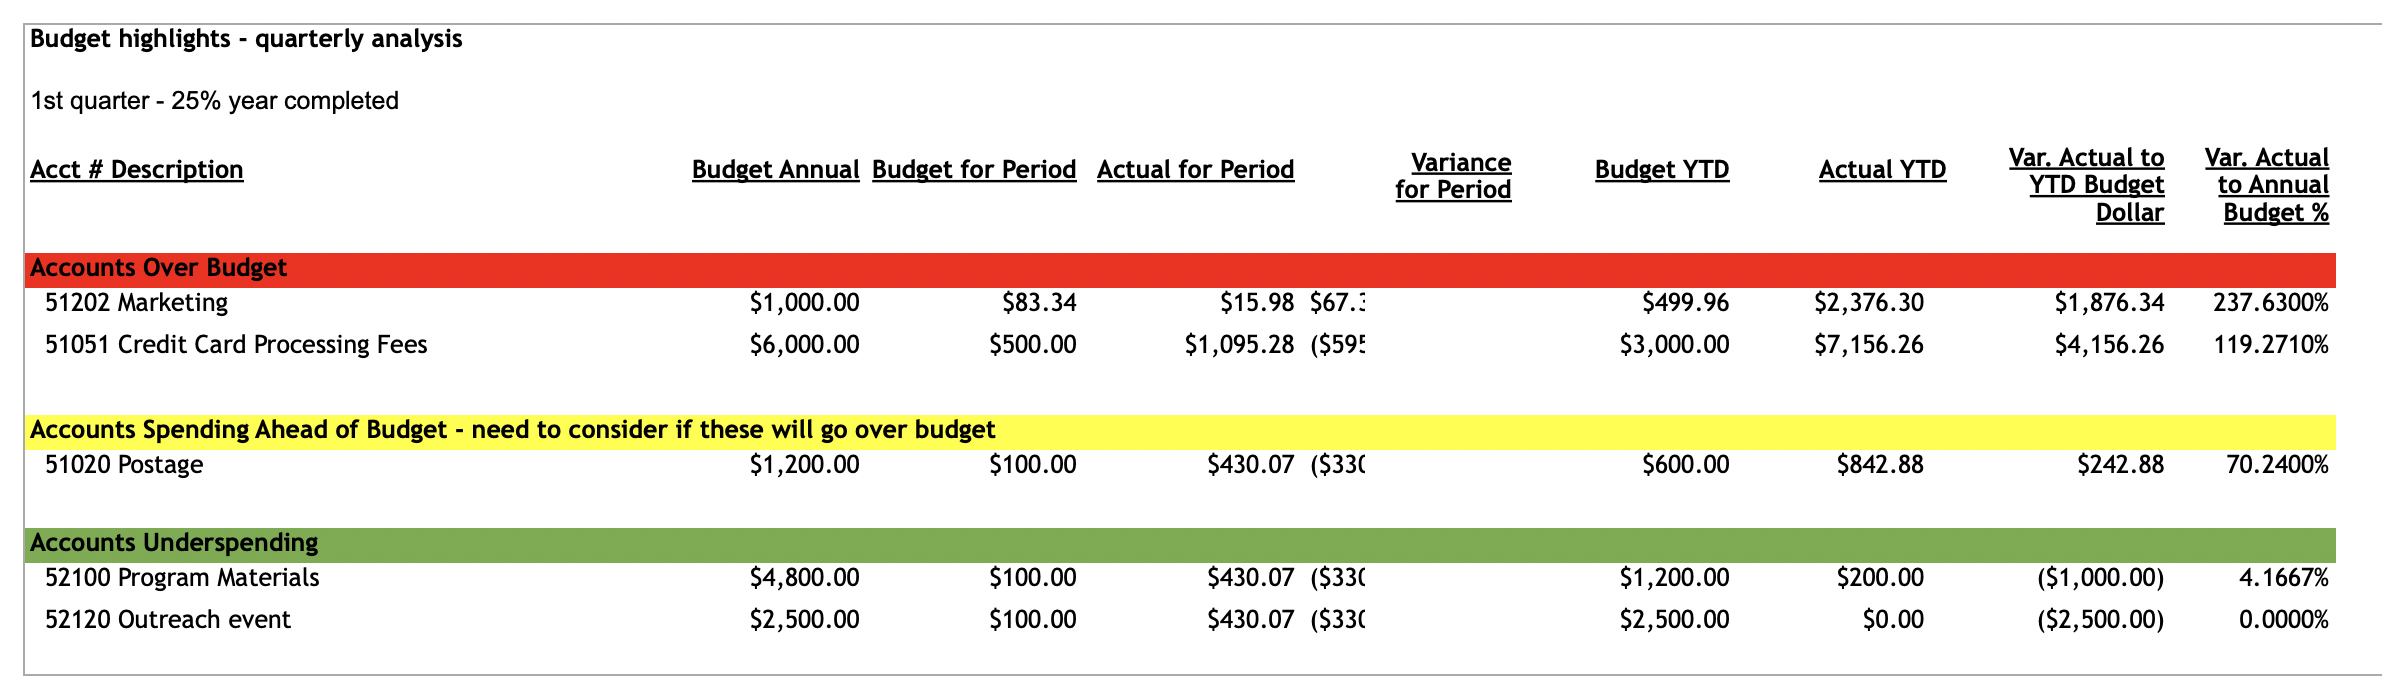
Regardless of which program you use, you’ll start by generating a report containing the following elements:
- Annual budget numbers
- Actual YTD spending
- Planned YTD spending
- Current spending calculated as a percentage of annual budget
Key Considerations of the Red Light Green Light Nonprofit Budget Report
At this point, you may be wondering, “Shouldn’t our spending just be the same percentage of the year that has passed? If we’re a quarter of the way through the year, then shouldn’t we be 25% through the budget?” Well, it really does depend. You might have some items that are seasonal and I would really recommend allocating your budget based on when you plan to spend for those seasonal items, so it becomes a cash flow plan. (We’ll talk about that in another lesson) But then in that case, your budget YTD numbers won't necessarily be 25% at the end of the first quarter. In fact, it’s possible that your first quarter spending may actually be at 100% already if that event or activity happened during the first quarter.
On the other hand, it may be that your spending looks very linear over the course of 12 months, in which case, you should be at 25% of annual budget when you’re 3 months into a 12 month year. If this is the case, any number greater than 25% should prompt a question about potential overspending, at which point you can look at the difference in dollars between budget YTD and actual YTD.
When analyzing this report, I recommend sorting your results by the percentage ahead of budget (or over budget) and looking more closely at those items. Review the detailed ledger to see where money was spent and for what purpose. You’ll need to look deeper into these items so that you know what to expect going forward.
For example, you may realize as you investigate an over budget item, that you actually just forgot to budget for the copier and you can expect that expense every month. In this case, you might need to tweak your budget as a results of this report.
You may notice something in the detailed ledger that is actually in the wrong category. This allows you to make that correction earlier in the year.
The Major Takeaway of the Red Light Green Light Nonprofit Budget Report
I really don't want budgets to feel like a straight jacket nor do I want this tool to feel restrictive or solely about the red lights. The purpose of this tool is to continually be asking yourself, “What does this mean going forward?”
I want to also emphasize the flip side of the red light- the green light! Be sure to look at the other extremes of those spending percentages. What spending items are way below their YTD expectations and have large amounts of money left over? This is often a place where money is just left on the table. These dollars may actually be opportunities!
If you budget to do something, but don’t do it, then a mid-year correction can help put those resources to better use elsewhere. You may have a staff member who ends up not needing the resources they asked for. Do they have something else they’re dreaming of that could become reality with a simple mid-year reallocation? Maybe money is not being spent as expected because a staff member is not doing what they’re supposed to be doing. In that case, the green lights on this report may help bring that to the surface.
I hope this is helpful to you as a nonprofit leader! I know we all need a strategic thinking partner when it comes to nonprofit finance. I know today’s post has been more math-focused, so if you need some help crunching numbers and getting a template set up specifically for your organization, please reach out! I'd be happy to do that. Don't hesitate to book a strategic consult with me. If you're looking for more tips like this, you can subscribe to my blog, follow me on LinkedIn, or subscribe to my Youtube channel so you don't miss my weekly content that I hope will help you in what you're called to do.
Sign Up to Receive Financial Tips in Your In Box
We hate SPAM. We will never sell your information, for any reason.